Bokeh 开源 Python 可视化库可帮助开发人员创建 Web 浏览器视觉效果。您可以为 Web 应用程序构建图表,无需编写任何 JavaScript,就像您需要使用 d3.js 和 plotly 等库一样。
Bokeh 可以仅使用 Python 创建许多常见和自定义的可视化效果,例如我们将在本教程中创建的条形图:
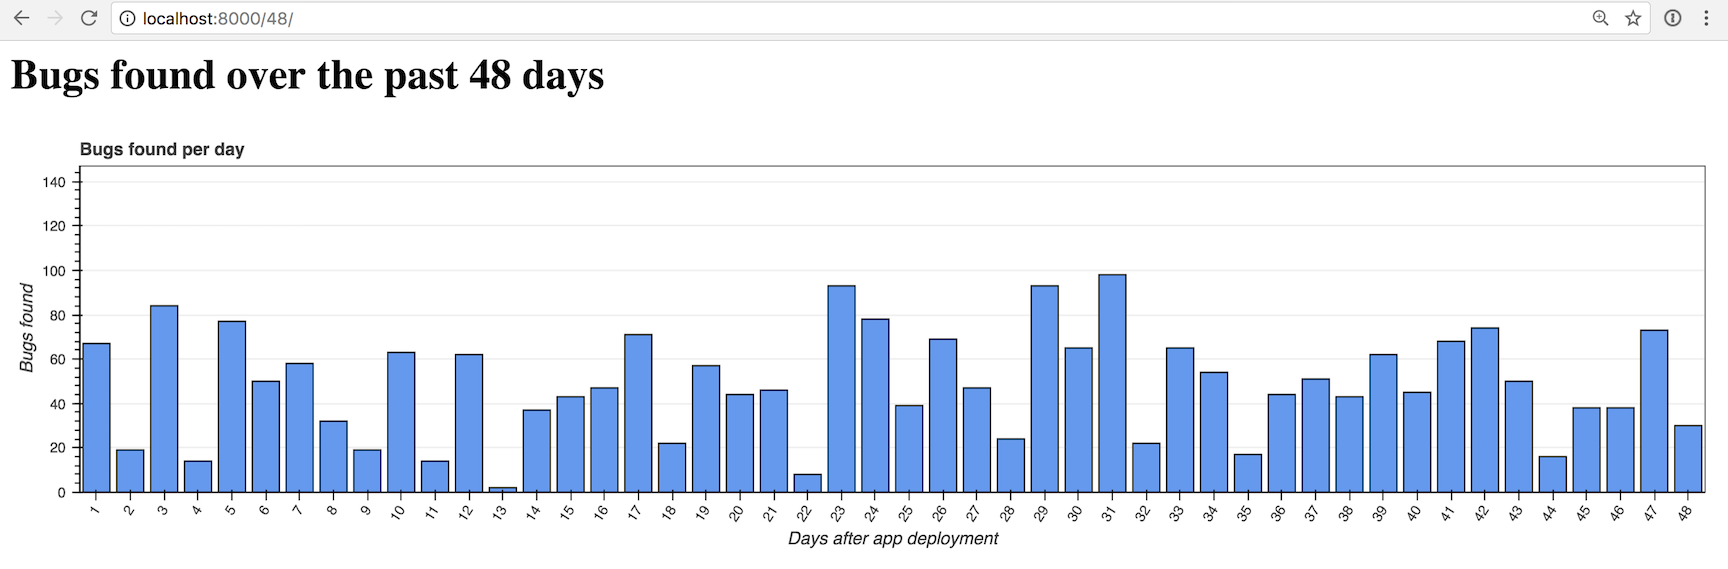
让我们使用带有 Bokeh 的 Bottle Web 框架来构建自定义 Python Web 应用程序条形图。
我们的工具
本教程适用于 Python 2 或 3,但强烈建议新应用程序使用 Python 3。我在写这篇文章时使用了 Python 3.6.2。除了整个教程中的 Python 之外,我们还将使用以下应用程序依赖项:
- Bottle web框架,版本0.12.13
- Bokeh数据可视化库,版本0.12.6
- pandas数据结构和分析库,版本0.20.3
- pip 和 virtualenv,它们与 Python 3 一起打包,用于安装 Bottle、Bokeh 和 pandas 库并将其与您正在处理的其他 Python 项目隔离
如果您在运行此代码之前需要配置开发环境方面的帮助,请查看此指南以在 Ubuntu 16.04 LTS 上设置 Python 3 和 Bottle。
这篇博文中的所有代码都可以在 GitHub 上的 blog-code-examples 存储库的 bar-charts-bokeh-bottle-python-3 目录下的 MIT 许可下获得开源。根据需要将源代码用于您的自己的项目。
安装 Bottle 和 Bokeh
在终端中使用以下命令为该项目创建一个新的虚拟环境以隔离我们的依赖项。我通常在一个单独的 venvs 目录中运行 thevenv 命令,我的所有 virtualenvs 都存储在该目录中。
python3 -m venv bottlechart
激活虚拟环境。
source bottlechart/bin/activate
激活 virtualenv 后命令提示符将发生变化:
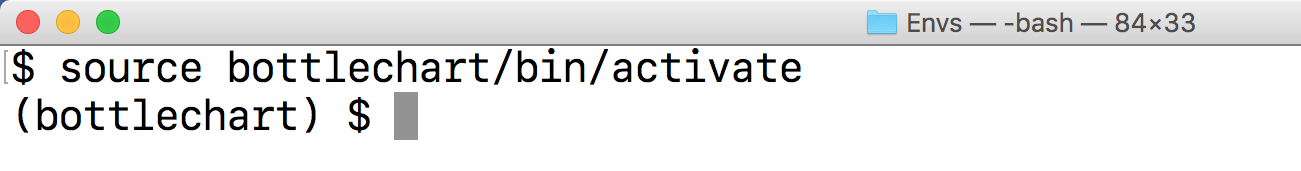
请记住,您需要在每个要使用 virtualenv 运行项目的新终端窗口中激活 virtualenv。
Bokeh 和 Bottle 可以安装到现在激活的 virtualenvusing pip 中。运行此命令以获得适当的 Bokeh 和 Bottle 版本。
pip install bokeh==0.12.6 bottle==0.12.13 pandas==0.20.3
经过短暂的下载和安装后,我们所需的依赖项将安装在我们的 virtualenv 中。
Installing collected packages: bottle, six, chardet, certifi, idna, urllib3, requests, PyYAML, python-dateutil, MarkupSafe, Jinja2, numpy, tornado, bkcharts, bokeh, pytz, pandas
  Running setup.py install for bottle ... done
  Running setup.py install for PyYAML ... done
  Running setup.py install for MarkupSafe ... done
  Running setup.py install for tornado ... done
  Running setup.py install for bkcharts ... done
  Running setup.py install for bokeh ... done
Successfully installed Jinja2-2.9.6 MarkupSafe-1.0 PyYAML-3.12 bkcharts-0.2 bokeh-0.12.6 bottle-0.12.13 certifi-2017.7.27.1 chardet-3.0.4 idna-2.5 numpy-1.13.1 pandas-0.20.3 python-dateutil-2.6.1 pytz-2017.2 requests-2.18.2 six-1.10.0 tornado-4.5.1 urllib3-1.22
我们现在可以开始编写我们的网络应用程序了。
构建 Bottle 应用
首先,我们将编写一个基本的 Bottle 应用程序,然后将条形图添加到呈现的页面。
为您的项目创建一个名为 bottle-bokeh-charts 的文件夹。在bottle-bokeh-charts 中使用以下代码创建一个名为app.py 的新文件:
import os
import bottle
from bottle import route, run, template


app = bottle.default_app()

TEMPLATE_STRING = """
<html>
 <head>
  <title>Bar charts with Bottle and Bokeh</title>
 </head>
 <body>
  <h1>Bugs found over the past {{ bars_count }} days</h1>
 </body>
</html>
"""


@route('/<num_bars:int>/')
def chart(num_bars):
    """Returns a simple template stating the number of bars that should
    be generated when the rest of the function is complete.
    """
    if num_bars <= 0:
        num_bars = 1
    return template(TEMPLATE_STRING, bars_count=num_bars)


if __name__ == '__main__':
    run(host='127.0.0.1', port=8000, debug=False, reloader=True)
上面显示的代码提供了一个带有单个路由的简短 Bottle 应用程序,使用 chart 函数定义。 chart 接收任意整数值作为输入。 template 中的 chart 函数使用 TEMPLATE_STRING 中定义的 HTML 模板呈现 HTML 页面作为对传入请求的响应。
最后两行允许我们在端口 8000 上以调试模式运行 Bottle 应用程序。永远不要在生产部署中使用调试模式!像 Gunicorn 这样的 WSGI 服务器是为处理实际流量而构建的,并且更容易没有重大安全漏洞的配置。
我们现在可以测试我们的应用程序了。
确保您的 virtualenv 仍然处于激活状态,并且您位于 app.py 所在的项目的基本目录中。使用 app.py 命令运行 python。
(bottlechart)$ python app.py
在您的 Web 浏览器中转到 localhost:8000/16/。您应该会看到一条标头消息,其中包含过去 16 天内发现的错误数量。但是,目前还没有伴随该消息的条形图。
我们的单一 Bottle 路线已经到位,但不是很令人兴奋。是时候创建一个漂亮的条形图了。
使用 Bokeh 创建条形图
我们将使用一些新的 Python 代码来构建我们的基本 Bottle 应用程序基础,以使用 Bokeh 库。
打开 app.py 备份并添加以下突出显示的导入行。
import os
import bottle
import random
from bokeh.models import (HoverTool, FactorRange, Plot, LinearAxis, Grid,
                          Range1d)
from bokeh.models.glyphs import VBar
from bokeh.plotting import figure
from bokeh.charts import Bar
from bokeh.embed import components
from bokeh.models.sources import ColumnDataSource
from bottle import route, run, template
我们应用程序的其余部分将使用这些导入来生成随机数据和条形图。
我们的条形图将以“发现软件错误”为主题。每次生成页面时,数据将随机生成。在实际应用程序中,您当然可能拥有更稳定和有用的数据源。
继续修改 app.py,使导入后的部分看起来像下面的代码。
app = bottle.default_app()

TEMPLATE_STRING = """
<html>
 <head>
  <title>Bar charts with Bottle and Bokeh</title>
  <link href="http://cdn.pydata.org/bokeh/release/bokeh-0.12.6.min.css"
        rel="stylesheet">
  <link href="http://cdn.pydata.org/bokeh/release/bokeh-widgets-0.12.6.min.css"
        rel="stylesheet">
 </head>
 <body>
  <h1>Bugs found over the past {{ bars_count }} days</h1>
  {{ !the_div }}
  <script src="http://cdn.pydata.org/bokeh/release/bokeh-0.12.6.min.js"></script>
  <script src="http://cdn.pydata.org/bokeh/release/bokeh-widgets-0.12.6.min.js"></script>
  {{ !the_script }}
 </body>
</html>
"""


@route('/<num_bars:int>/')
def chart(num_bars):
    """Returns a simple template stating the number of bars that should
    be generated when the rest of the function is complete.
    """
    if num_bars <= 0:
        num_bars = 1
    data = {"days": [], "bugs": [], "costs": []}
    for i in range(1, num_bars + 1):
        data['days'].append(i)
        data['bugs'].append(random.randint(1,100))
        data['costs'].append(random.uniform(1.00, 1000.00))

    hover = create_hover_tool()
    plot = create_bar_chart(data, "Bugs found per day", "days",
                            "bugs", hover)
    script, div = components(plot)
    return template(TEMPLATE_STRING, bars_count=num_bars,
                    the_div=div, the_script=script)
chart 函数获得了三个由 Python 3 超级方便的随机模块随机生成的新列表。
chart 调用了两个函数,create_hover_tool 和 create_bar_chart。我们还没有编写这些函数,所以让我们现在就做。在 chart 函数下方、if __name__ == '__main__': 行之前添加这两个新函数。
def create_hover_tool():
    # we'll code this function in a moment
    return None


def create_bar_chart(data, title, x_name, y_name, hover_tool=None,
                     width=1200, height=300):
    """Creates a bar chart plot with the exact styling for the centcom
       dashboard. Pass in data as a dictionary, desired plot title,
       name of x axis, y axis and the hover tool HTML.
    """
    source = ColumnDataSource(data)
    xdr = FactorRange(factors=data[x_name])
    ydr = Range1d(start=0,end=max(data[y_name])*1.5)

    tools = []
    if hover_tool:
        tools = [hover_tool,]

    plot = figure(title=title, x_range=xdr, y_range=ydr, plot_width=width,
                  plot_height=height, h_symmetry=False, v_symmetry=False,
                  min_border=10, toolbar_location="above", tools=tools,
                  responsive=True, outline_line_color="#666666")

    glyph = VBar(x=x_name, top=y_name, bottom=0, width=.8,
                 fill_color="#6599ed")
    plot.add_glyph(source, glyph)

    xaxis = LinearAxis()
    yaxis = LinearAxis()

    plot.add_layout(Grid(dimension=0, ticker=xaxis.ticker))
    plot.add_layout(Grid(dimension=1, ticker=yaxis.ticker))
    plot.toolbar.logo = None
    plot.min_border_top = 0
    plot.xgrid.grid_line_color = None
    plot.ygrid.grid_line_color = "#999999"
    plot.yaxis.axis_label = "Bugs found"
    plot.ygrid.grid_line_alpha = 0.1
    plot.xaxis.axis_label = "Days after app deployment"
    plot.xaxis.major_label_orientation = 1
    return plot
这是很多新代码。 create_hover_tool 函数除了返回之外还没有做任何事情。 None,当图形不需要悬停工具时使用。
在 create_bar_chart 函数中,我们获取随机生成的数据源并将其转换为 ColumnDataSource 对象,这是我们可以传递给的一种输入对象散景功能。我们为图表的 x 轴和 y 轴指定了两个范围。
tools 列表将保持为空,因为我们还没有悬停工具。很多魔法都发生在我们创建 plot 的行中使用 figure 函数。我们指定了我们希望我们的图形具有的所有参数,例如大小、工具栏、边框以及图形是否应响应更改 Web 浏览器大小。
VBar 对象创建垂直条以使用 add_glyph 函数将它们添加到绘图中。
函数的最后几行改变了图形的外观。例如,我们通过指定 Bokeh 去掉了 plot.toolbar.logo = None 标志,并为两个轴添加了标签。我建议保持 bokeh.plotting 文档处于打开状态,以便您了解自定义图表和可视化的选项。
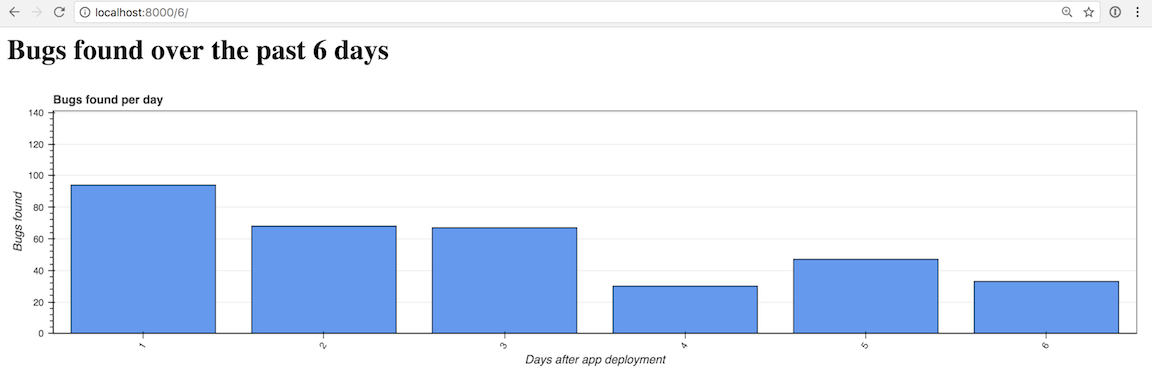
让我们通过 6 条形图来测试我们的应用程序。当您使用新代码保存 app.py 时,Bottle 应用程序应该会自动重新加载。如果关闭开发服务器,请使用 python app.py 重新启动它。
当您启动开发服务器时,您将收到以下警告,因为我们使用的是最新的(在撰写本文时)0.12.6Bokeh 版本。
/Users/matt/Envs/bottlechart/lib/python3.6/site-packages/bokeh/util/deprecation.py:34: BokehDeprecationWarning:
The bokeh.charts API has moved to a separate 'bkcharts' package.

This compatibility shim will remain until Bokeh 1.0 is released.
After that, if you want to use this API you will have to install
the bkcharts package explicitly.
最终将需要一个单独的bkcharts 项目,但现在我们可以保持代码不变。
打开浏览器到 localhost:8000/6/。
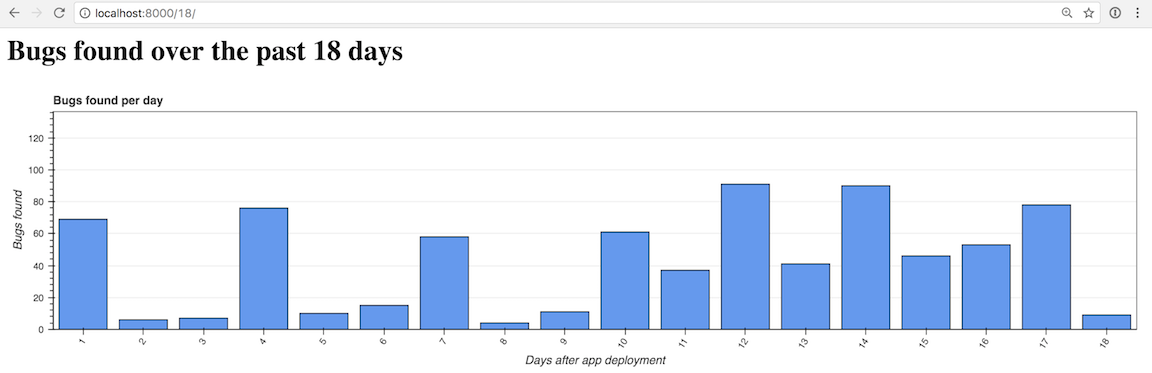
那个看起来有点稀疏,所以我们可以通过转到 localhost:5000/18/ 将其调高 3 倍至 18 格。
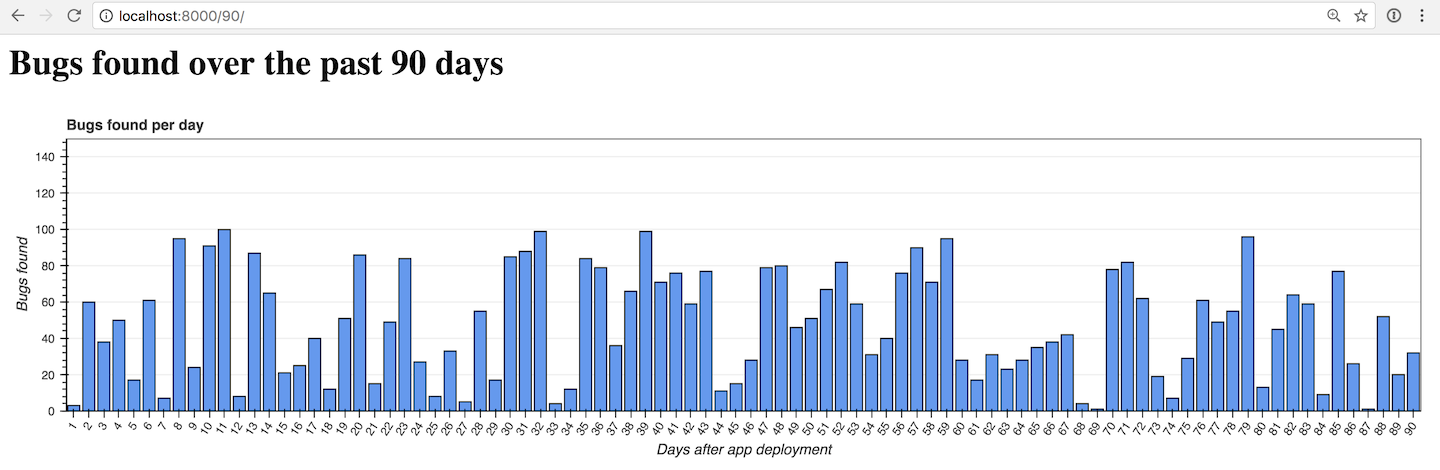
现在使用 localhost:5000/90/ 再增加 5 倍到 90 根。
到目前为止看起来不错!我们跳过的那个悬停工具呢?我们可以在 create_hover_tool 函数中添加几行代码来添加悬停工具。
创建悬停工具
将这些突出显示的行添加到 app.py 函数中的 create_hover_tool。
def create_hover_tool():
    """Generates the HTML for the Bokeh's hover data tool on our graph."""
    hover_html = """
      <div>
        <span >$x</span>
      </div>
      <div>
        <span >@bugs bugs</span>
      </div>
      <div>
        <span >[email protected]{0.00}</span>
      </div>
    """
    return HoverTool(tooltips=hover_html)
在您的 Python 应用程序中嵌入 HTML 通常不是一个好主意,但它适用于像这个悬停工具这样的小片段。悬停工具使用 $x 来显示栏的 x 轴, ### 显示我们数据源中的“bugs”字段,@bugs 显示格式为美元金额的“成本”字段,小数点后两位数。### p>
确保您将函数中的 return None 更改为 return HoverTool(tooltips=hover_html),以便新代码的结果反映在刷新的图表中。
返回浏览器并重新加载localhost:8000/122/页面。
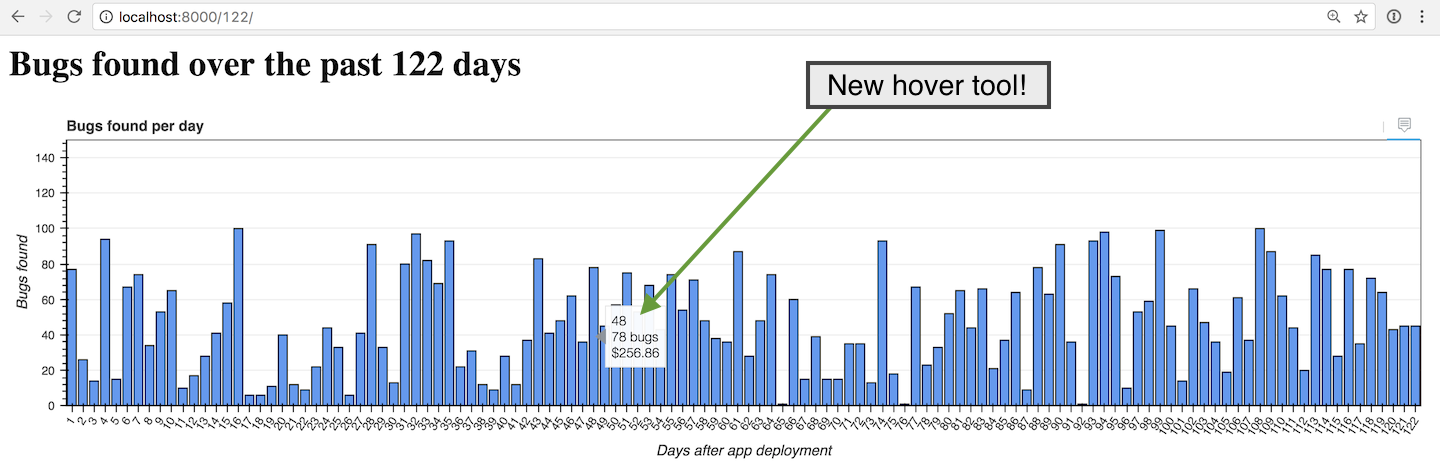
干得好!尝试调整 URL 中的条数和窗口大小,以查看图形在不同条件下的外观。
图表中有超过 100 个。但是,如果您的计算机可以处理渲染,您可以尝试创建任意数量的柱。此屏幕截图显示了完全不切实际的 40,000 个柱的样子:
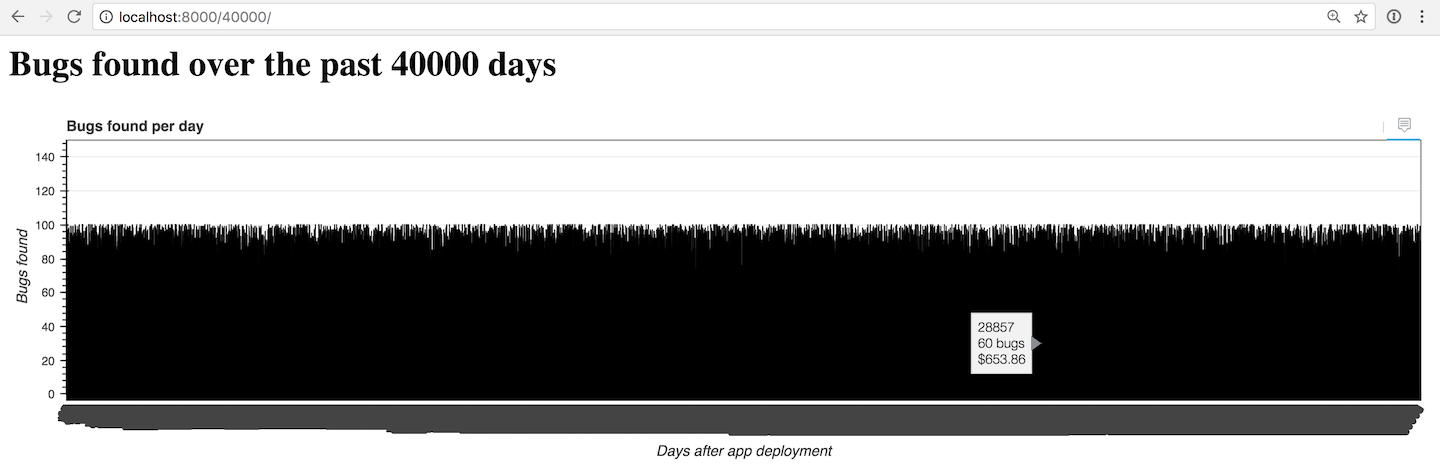
您可能需要做更多的工作才能让图表一次显示超过几百个柱。
现在怎么办?
我们使用 Bokeh 代码库创建了一个漂亮的小型可配置条形图。
接下来您可以更改输入数据源、使用其他类型的图表或修改图表配色方案。
Bokeh 能做的远不止这些。查看官方项目文档、GitHub 存储库、Full Stack Python Bokeh 页面或查看有关 Full Stack Python 的其他主题。
有问题吗?在 Twitter@fullstackpython 或@mattmakai 上通过 Full Stack Python 存储库上的 GitHub 问题单让我知道。
您认为这篇博文有什么问题吗?在 GitHub 上分叉此页面的源代码并提交包含修复的拉取请求。
